前言
有人会好奇,同样是点云,.pcd和 .ply 的处理能有啥大区别吗?
其实是有的,.pcd 文件的数据,是基于点的,也就是里面存储的内容全部都是和点相关的信息。
而 .ply 增加了关于面的信息,也就是有了 mesh。在介绍使用 MeshLab 进行点云表面重建的那篇文章中,已经提到过这点。几万个离散的点组成的点云,其中并没有面,除非你指定 𝑘 近邻,或者使用每3个点组成很多小的三角平面。
处理 .ply 文件,强烈建议使用 Matlab 的 Toolbox Graph 库,下载链接如下:
https://uk.mathworks.com/matlabcentral/fileexchange/5355-toolbox-graph
库中相关函数
PLY文件的读取
[vertex,faces] = read_mesh(name);
输出的 vertex 为所有点的坐标,这和 pcd.Location 一致。
而 faces则为构成每个面的 vertex的索引。
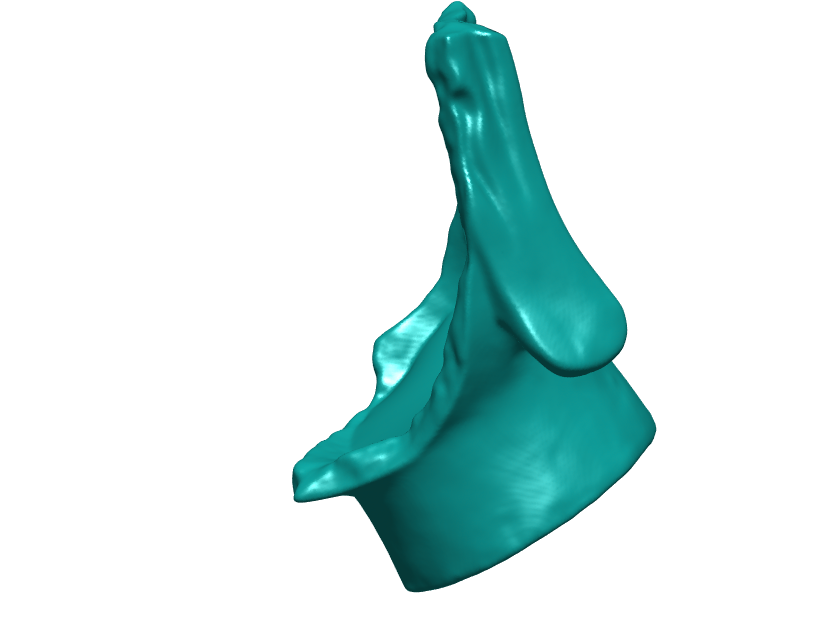
可视化 .ply格式的点云,也可以用之前用的 pcshow函数,但是 plot_mesh函数更好,因为其内置了光照效果。注意 plot_mesh函数的输入为 vertex 和 faces。
% read ply
name = 'head1.ply';
options.name = name;
[vertex,faces] = read_mesh(name);
% display the mesh
clf;
plot_mesh(vertex, faces);
shading interp;

求法向量
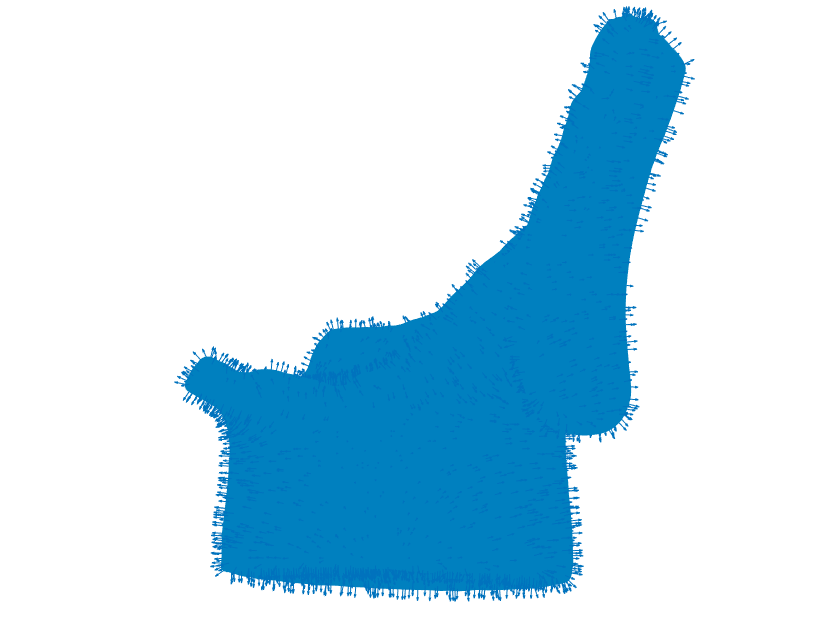
在toolbox中也内置了为.ply点云求法向量的函数compute_normal,此函数可以分别求出所有点,以及所有面的法向量。
[normal,normalface] = compute_normal(vertex,faces);
% display
options.normal = normal';
normal = normal';
normalface = normalface';
clf;
plot_mesh(vertex,faces,options);
shading interp;
axis tight;
options.normal = [];

求曲率
compute_curvature可以用来求点云的曲率
[Umin,Umax,Cmin,Cmax,Cmean,Cgauss,Normal]
= compute_curvature(vertex,faces,options);
参考文章
[1] Gabriel Peyre (2022). Toolbox Graph (https://www.mathworks.com/matlabcentral/fileexchange/5355-toolbox-graph), MATLAB Central File Exchange. Retrieved September 16, 2022.
